Documentation
ChicoryLane.com
Overview
The Web site includes a wide range of information, specific to ChicoryLane Farm but
potentially useful to others interested in ecological diversity at other locations.
To make this information accessible, the site is structured so that
once someone understands its organization and conventions, he or she should be able to navigate
and use it for a variety of purposes. This section describes that structure and provides more
detailed instruction for some of its interactive function.
The site includes three large sections and types of information:
- Conventional Web pages
- Database of Native Plants and Birds
- Google Map with Layers of Features and Search Results
One accesses the conventional pages using the navigation panel on the left.
The Map and Database are both accessed through the Database tag shown in that panel.
Conventional Web Pages
The sections we term Conventional Pages are the oldest.
They are constructed using basic Web resources (i.e., HTML), and
their information is largely static. That is, they include the kinds of
information that one might include in some form of conventional publication - both formal and informal -
such as a brochure, a journal entry, or a handout. This is in contrast to more
dynamic information that takes advantage of the malleable nature of information
accessed through a database or other computational components.
This information is organized
under ten or so topics:
- Site Map - The structure and function of the site.
- Areas - Environmentally distinct parts of the farm.
- Maps - Hand-drawn maps depicting the different environmental areas.
- Gallery - Slideshows of areas, events, plants groups, and, more recently,
videos, and panoramas.
- Database - Dynamic data for native plants and birds observed at ChicoryLane
(additional information, following).
- Events - Events held at the Farm, listed by year.
- Awards - Historical Preservation Award
- History - Traces early history of the house and farm from first deeding in 1766,
including extensive list of previous owners.
- Blog - Reflections on our sense of place for ChicoryLane and its ecological
diversity.
- Resources - Vendors we have used and experts who have generously given their
help.
Webmaster - email contact to get in touch with us - feedback and questions
welcomed!
Selecting a topic from the navigation panel on the left leads to an overview
page for that topic. There, you will find general information on the topic
and links to additional pages for more detail. We urge you to explore
these topics and links.
Specific Topics
Several of the topics listed above may benefit from further description.
Gallery includes several kinds of visual information.
Many of the items are slideshows. Several controls are included with each image that
the user should know how to use and which will be explained with regard to the
screenshot, below.
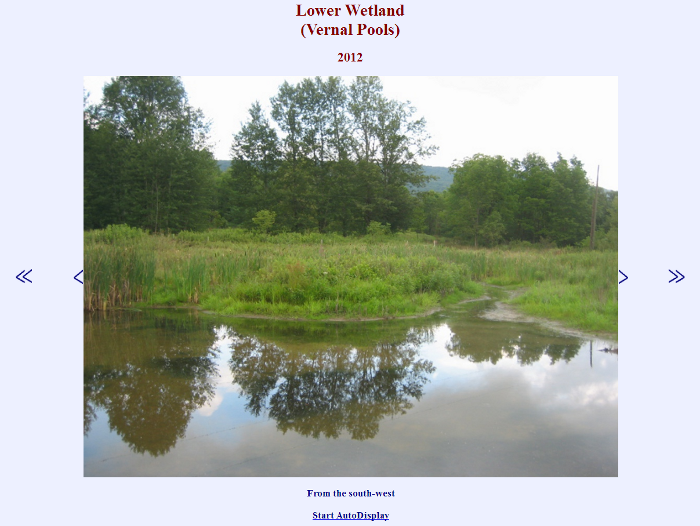
When the link to the slideshow is selected, a process will begin to preload all the
images so that the slideshow can proceed smoothly. Once it begins, images will be
displayed automatically, one after another. However, the automatic display can be
interrupted and the images shown manually. Note the single and double arrows on each side of
the display. A click on any of the arrows interrupts the automatic display; automatic display
can be resumed by selecting the Start Autodisplay link at the bottom. The single arrow on the right
both interrupts the automatic sequence and moves the display to the next image in the
slideshow. The double arrow moves the display to the last image in the
slideshow. The single arrows on the left move the display to the previous image
and to the first image in the slideshow, respectively After all images
have been shown, an alert notice will announce the end of the slideshow.
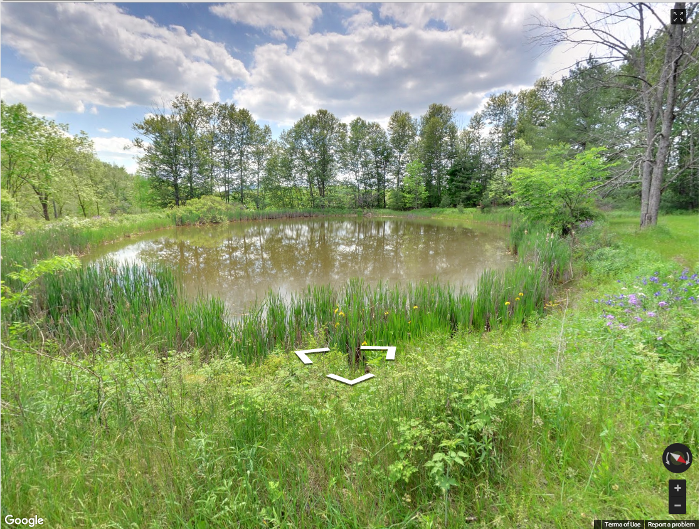
The gallery also includes links to videos that will be streamed when selected.
Links to panoramas will stream Google StreetView-type tours of several areas of
the Farm. Clicking and dragging on an image will cause the image to rotate,
potentially showing a full 360° view of the area, including up and down
elevations. Each image in a tour also includes one or more arrows.
Selecting an arrow will cause another image or view in the tour to be
downloaded. See the screenshot, below. But to try out the function, select
a panorama from the gallery.
Blog includes more general discussions of concepts, personal
experiences, and reflections on our evolving understanding of what we are
trying to accomplish. They are mini-essays, op-ed pieces of a
sort. Topics include the following:
- Values and Goals
- Perceptions of the Place
- A Sense of Place
- A Spring Weed Walk
- Managing Land for Ecological Diversity
- Weed Walk: Graminoids
We would like the blog to stimulate conversation on ecological issues; so we
encourage readers to attach comments or questions to individual pieces, by
selecting the comments tag at the end of each piece. (Doing
so also displays any prior comments.):

We also invite new posts of pieces. Unfortunately, out blog software does
enable this as a public function, but anyone wishing to do so can be added as a
poster by sending us a request using the Webmaster email function
available from the navigation panel on the left.
Database
Database is accessed from the left navigation panel. It includes information on
the native plants and the birds that have been identified on ChicoryLane. Two
types of information are included for both. Type information lists each
plant or bird once and includes both common and scientific names for each as
well as class (e.g., shrub, tree, vine, etc.).
Observation information usually includes multiple entries for each type
and includes information about a particular occurrence or observation of a plant
or bird - that is occurring at a particular place on the Farm, a particular time,
and other details specific to that particular observation.
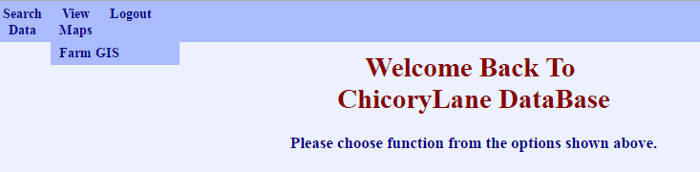
Both types of information are accessed from the Search Data pull down
menu at the top of the Welcome and subsequent Database Pages:
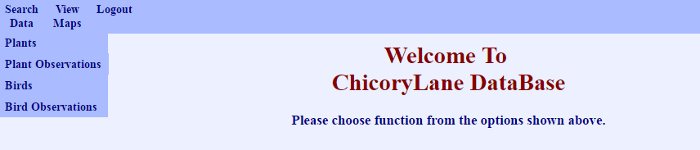
Selecting Plants, as shown above, will result in a form to control a
search of the database. Selecting Plant Observations will result
in a different form with fields appropriate for individual occurrences. Examples
of each will be shown, below. Important to understand is that each field
for which data are entered constrains a search. If no data are entered
into the form and Search is selected, all of the data in the Database
of that type will be retrieved and displayed. If for the Common Name the word,
Canada, is entered, the system will locate all entries for which the Common Name
includes that word (or part of a word).
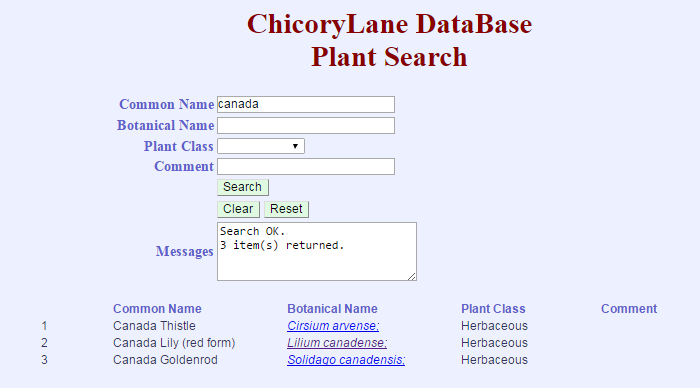
Of course, all or part of the Botanical Name may be specified, the Plant Class,
or words that might be included in a Comment. As well as any combination
of these fields.
Once the Search is completed and the data displayed, the user may change
the order of the listing. By selecting the label, Common Name, in
the results display will sort the items into alphabetic order by those values.
Similarly for Botanical Name, Plant Class, and Comment.
Try it out!
Selecting Plant Observations from the top menu, results in a different form, as
shown below:
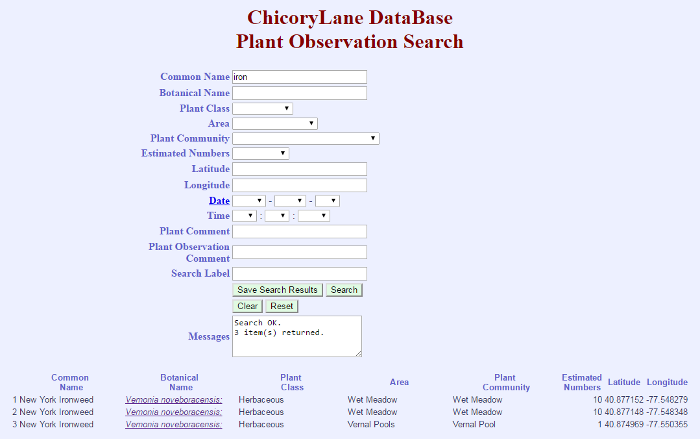
Note the additional form fields into which request parameters may be included.
Experience and experimentation will clarify their effects on search. Note,
also, that the Botanical Names retrieved are underlined, usually indicating in a
Web application that they are links to other pages or sites. In this
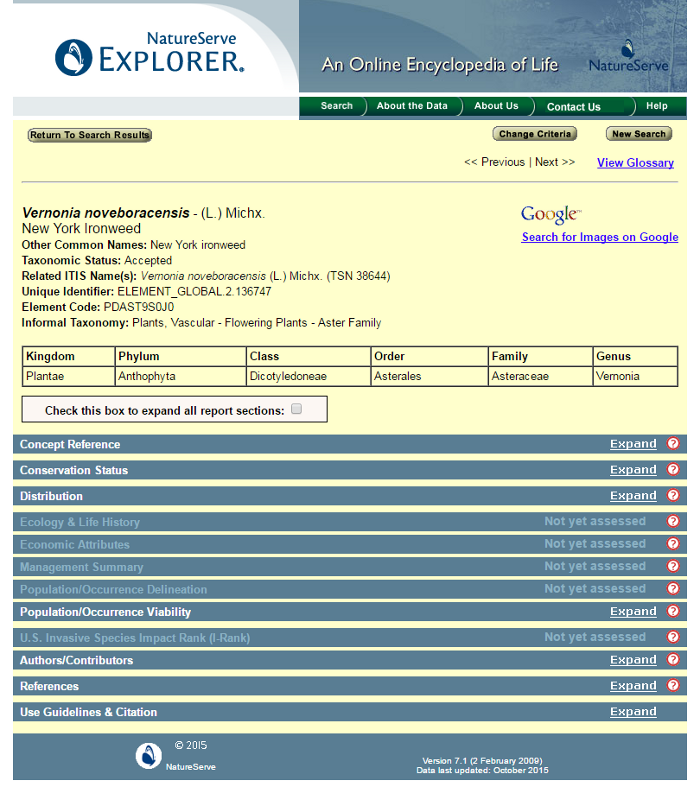
case, selecting a particular Botanical Name results in a jump to an external
reference for this plant from NatureServe,
a nonprofit organization that provides scientific expertise for conservation.
Below is their top-level entry for New York Ironweed:
Similar type and observation forms are available for bird data. Fields
will differ slightly, appropriate for birds vs. plants. External
references are also available for birds from the
CornellLab of Ornithology: All About
Birds.
One final point: in the search results for New York Ironweed, shown above,
note the last field in the form, Search Label. It can be used to link
Database results to a map or aerial view of the Farm. More on this,
following.
GIS Map
GIS Map is a set of resources that provide information about ChicoiryLane Farm
in visual form. Based on Google's maps api, these resources provide maps
and aerial images of ChicoryLane as well as overlays of specific features.
Aerial views include a recent satellite image; aerial views from 1938, 1957, and
1971; and a topological map. Overlays, termed Layers, include
ecological areas, paths, soils, video and panorama locations, and tentative
easement boundaries. Search results from the Database may also be imported into
a map, showing locations for each observation and, for many, providing access to
an image of the plant or bird at that spot.
GIS Map is accessed from a Database top menu, under the View Maps drop
down menu, as shown in the screen image, below.
The default view in the GIS Map system is a recent satellite image. Other images
may be shown by selecting one of the options shown in the top bar, such as
1938 or Soils. Layer and Search
Results data are superimposed on one of these underlying images. The
top menu items on the right provide access to these data and functions, and will
be discussed, below.
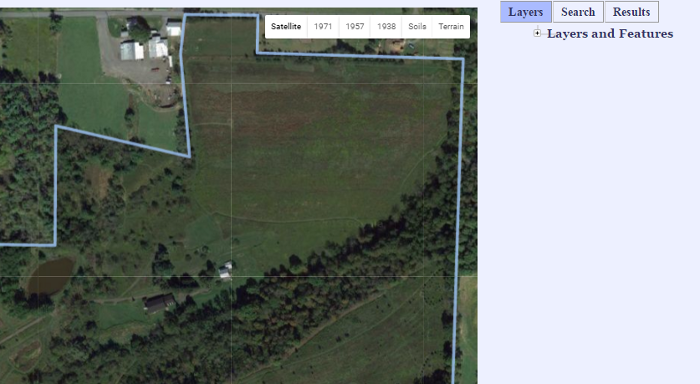
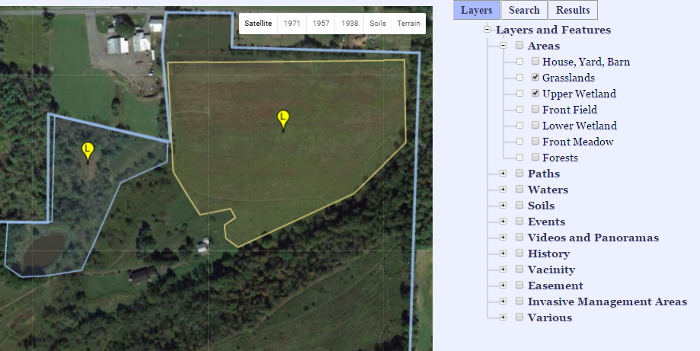
The screen image below illustrates the kinds of data and views that are included
under Layers. By selecting Layers from the top menu and
drilling down, using the plus (+) sign, one can select all items under a
particular layer or a subset of available items. In this example, the user has
drilled down to Areas and selected two of them: Grasslands and
Upper Wetlands. The selected areas are shown in outline and shaded.
A marker in each is also included which, if selected, will show an photograph
from the area. All items under a layer may be shown (or hidden) by selecting (or
unselecting) the checkbox beside the layer name.
Multiple layers may be overlaid on one-another. In the image below, the
Upper Wetland area is shown, but also the Paths for both that
area and the Grassland area.
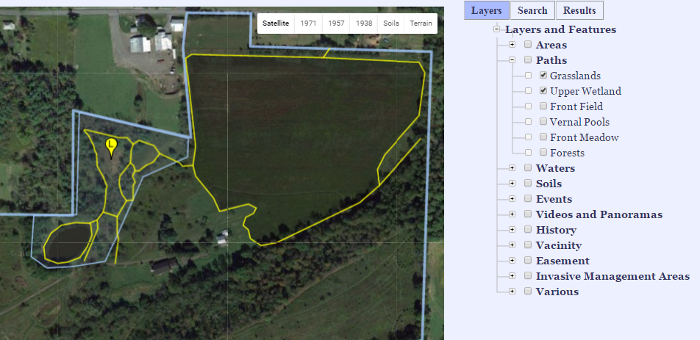
A number of different layers are provided. The user is urged to explore
them singularly and in combination.
Earlier, it was noted that the Database and the GIS Map systems could be used
together. For example, one may do a search for occurrences of a particular
plant. The results of that search can then be saved and imported into the
Map function to show their specific locations on the map.
Searching the database for plant or bird observations and then showing their
locations on a map is a three-step process. First, one must of a search
using one of the database's observation search forms. One can get such a
form either by returning to a database tab and selecting a search from the
drop-down menu, as shown above in the Ironweed example. Alternatively, one may
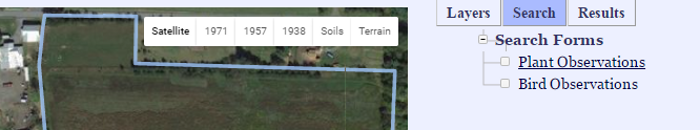
go directly to a search from within the Map tab. To do so, select the
Search from the menu bar at the top right and as shown, below.
Then, drill down to either the Plant Observation or Brid
Observation option and select the desired one (in this case, select
the term, itself). Doing so will open an observation search form.
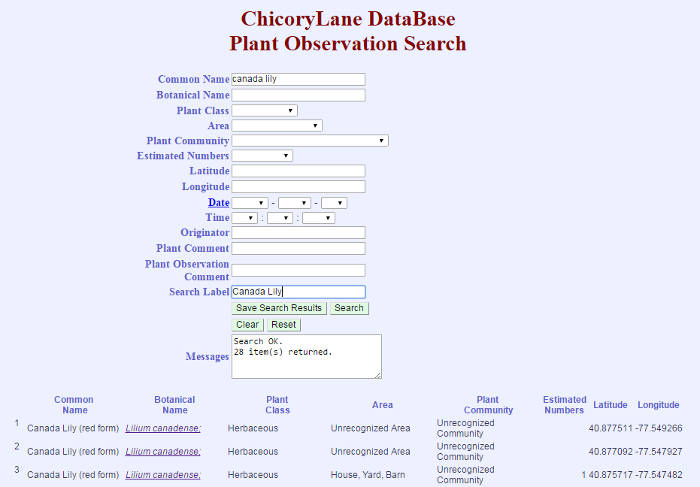
Second, do a conventional observation search. Third, when one has the desired
results, enter a label for those particular search results. In the example
below, the search was for Canada Lilies, and the user has entered Canada
Lily as the label it will be known by in the Map function. End this part of
the task by selecting the Save Search Results button at the bottom.
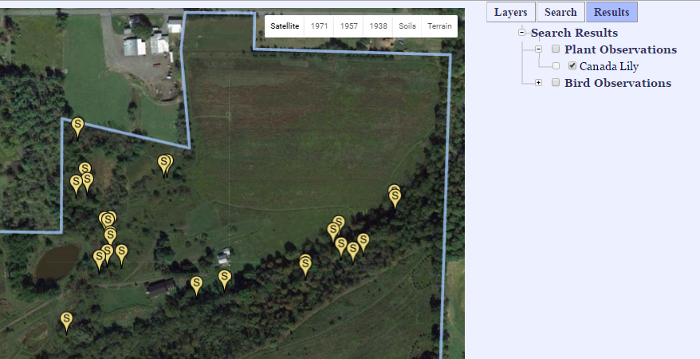
Third, following the search step, return to the Map function. Select the
Results menu option at the top right and drill down to the type of
observations that were searched - in this case Plant Observations.
There will appear all of the results that were saved in prior search, identified
by the assigned labels included in the search step - in this case, Canada
Lily. Clicking on the check box will show locations for all of the
observations found.
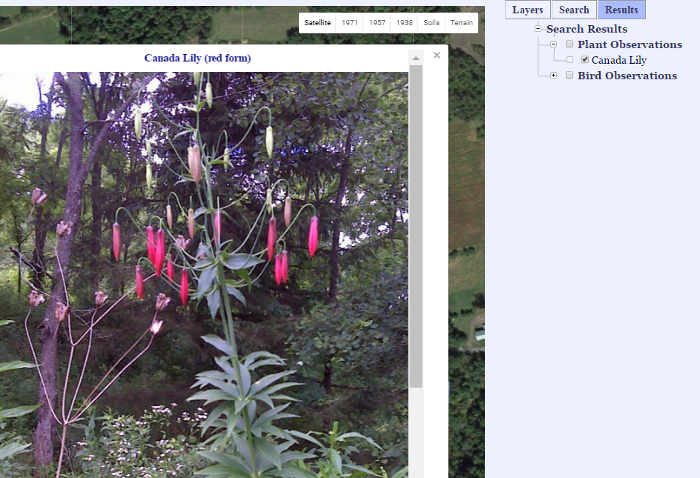
Selecting one of the observation location marks will, in turn, show an
image for that particular item, as shown below. (However, not all
observations have accompanying images.) If the label under Search
Resultsis selected, instead
of the checkbox, a slideshow will be shown that includes all images
available for the particular search result.
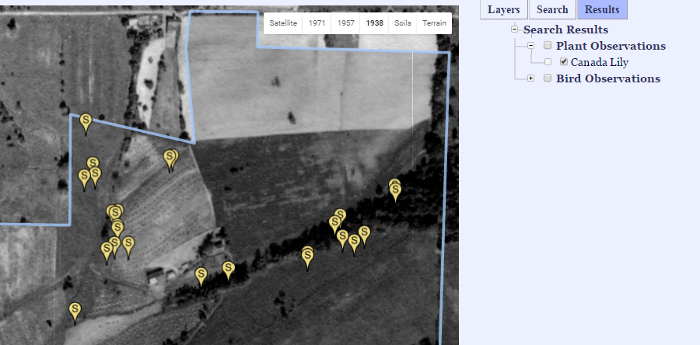
Sometimes it is interesting to see current plant observation, whose locations
are defined by latitude and longitude, superimposed over an earlier view of the
farm. Below, today's Canada Lily locations are shown over a view of what
the farm looked like in 1938. (Done by selecting the 1938 option
in the menu bar at the top, instead of the Satellite option.) Here, one
can note that many of these usually wetland plants are in locations that, in
1938, were crop or hay fields or pastures. A very different land use today from
then!
August 1, 2016 http://www.chicorylane.com/